If you’re thinking about your most profitable customers, you’re probably thinking about the ones who spent the most money at you, right? Well, you could be wrong. For example, somebody could buy the most expensive item on sale, but then never returns to buy anything else. On the other hand, a customer could buy the cheapest product, but then returns and regularly buys something from you. Which of these customers is the most profitable and on which customers you should focus most?
With the help of RFM analysis you take into account multiple dimensions of customers buying behaviour (usually R-recency, F-frequency and M-monetary) in the selected time period. Based on the scores in the individual dimension, customers are segmented into multiple groups, with best customers with highest score on top.
For example, we will try to compare 5 different customers, who all made purchases in total amount of 1.500 €, but with different number of purchases at different times.
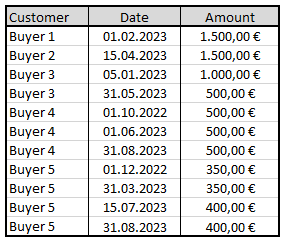
Data needed for RFM calculation:
- Buyer ID
- Date of purchase/Invoice
- Total amount of Invoice
In the first step, we need to summarize the data and prepare the values of all three components for RFM valuation.

- Recency – Number of days between current date and last purchase
- Frequency – Number of purchases in the selected period
- Monetary – Sum of purchases
In the next step, we must prepare and define weights for all three components. Mostly used option are groups with 5 levels. In case we need deeper insight into our customers, we can also define more levels. I prefer option with 10 levels when number of buyers exceeds e.g. 50.000 buyers, because targeting and cost/revenue calculations are more precise.

Now can we assign the corresponding number of points to each component.

Based on the total sum or average of the points, we can segment customers into e.g. 5 groups – marked with numbers (5 -> 1) or with descriptive group names (Top, Good, Average, …).
From above example we can see how additional dimensions simplify the option to rate buyers buying behaviour. Based on periodical RFM analyses, we can easily track the trends of our customer groups (upgrowth, downgrowth,…).
Businesses that don’t have Monetary aspect, can use Engagement dimension instead (e.g. readership, viewership or any other engagement type parameter).
In my next Blog », i’ll explain how to use Excel as a tool for RFM analyses